Most distributors manage thousands of items, but those items do not deserve the same amount of attention.
Some products account for a large share of inventory value or sales activity.
Others move occasionally and have a much smaller financial impact. Treating both groups to the same can create extra work for buyers, planners, and warehouse teams.
ABC inventory analysis gives distributors a way to separate those items into groups and manage each group differently. It goes with products that are ranked using a chosen measure, often annual consumption value, then grouped into A, B, and C classes.
A-items receive the closest attention; B-items sit in the middle, and C-items usually require less frequent review.
The value comes from how the classification is used after the calculation.
In this guide, we’ll look at how ABC inventory analysis works, which inputs matter, how distributors where the method can fall short, and how ERP data affects the quality of the final classification.
What is ABC inventory analysis?
ABC inventory analysis is a method used to rank inventory items based on their relative importance to the business.
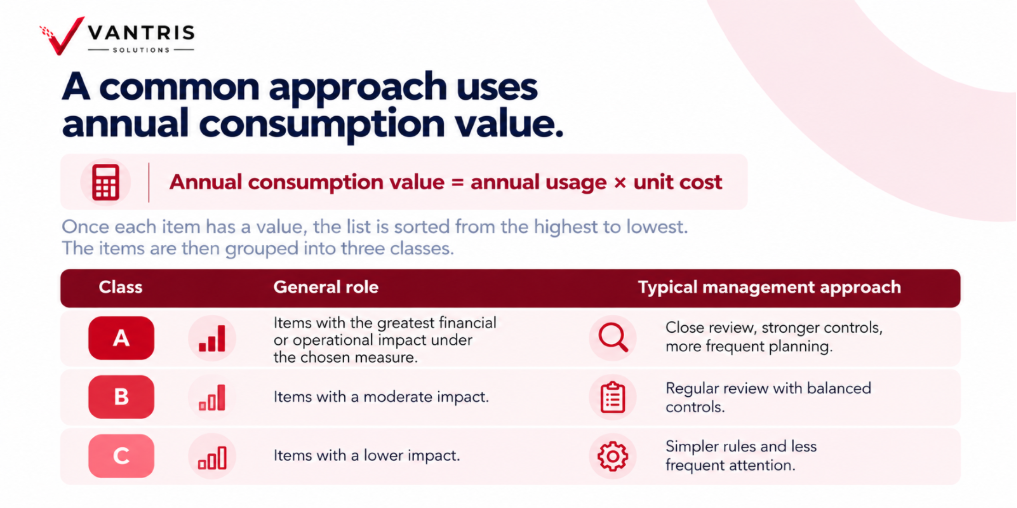
A common approach uses annual consumption value.
Annual consumption value = annual usage × unit cost
Once each item has a value, the list is sorted from the highest to lowest. The items are then grouped into three classes.
| Class | General role | Typical management approach |
| A | Items with the greatest financial or operational impact under the chosen measure | Close review, stronger controls, more frequent planning |
| B | Items with a moderate impact | Regular review with balanced controls |
| C | Items with a lower impact | Simpler rules and less frequent attention |
The letters themselves do not tell you how valuable an item is in absolute terms. They show how each item compares with the rest of the inventory using the measure you selected.
Two distributors can sell the same product and classify it differently because their volume, cost, customer mix, and inventory strategy are different.
How ABC inventory analysis works
The calculation is simple enough, but the inputs need to be clean.
A basic workflow looks like this.
ABC inventory workflow
Choose the measure you want to rank
↓
Pull item-level usage and cost data
↓
Calculate annual consumption value
↓
Sort items from highest to lowest value
↓
Calculate cumulative contribution
↓
Assign A, B, and C groups
↓
Review the groups with purchasing and operations
↓
Apply different planning rules were useful
↓
Review the classification again as the business changes
The calculation gives you the first version of the classification. The operational review matters just as much.
A technically correct ranking can still produce poor inventory decisions if the data is old; unusual demand is mixed into the history, or business-critical items are treated as unimportant because their annual dollar value happens to be low.
A simple ABC inventory example
Here is a small illustrative example.
The numbers below are only here to show the method. They are not industry benchmarks or recommended cutoffs.
| Item | Annual usage | Unit cost | Annual consumption value | Relative position |
| Item A | 4,000 | $40 | $160,000 | High |
| Item B | 2,500 | $30 | $75,000 | High |
| Item C | 1,000 | $25 | $25,000 | Middle |
| Item D | 700 | $10 | $7,000 | Lower |
| Item E | 300 | $8 | $2,400 | Lower |
After calculating annual consumption value, the items are sorted from highest to lowest.
The distributor then decides where the A, B, and C boundaries make sense.
Many articles present fixed percentages for each class. Those numbers can be useful as examples, but they should not be treated as a universal rule.
The cutoffs should fit the business.
A distributor with 2,000 SKUs may want a manageable A-class which buyers can review closely.
A distributor with 50,000 SKUs may need a different breakdown. Product mix matters too. A business with a few expensive items and thousands of low-cost parts will look very different from one with a more even inventory profile.
The classification should support better decisions, not force the inventory into a textbook percentage.
What distributors can do with ABC classifications
ABC analysis becomes useful once each class changes how the business manages inventory.
For A-items, teams may want tighter review around demand, supplier performance, lead times, reorder settings, and inventory availability.
Small errors can have a larger financial effect because these items represent a larger share of the selected measure.
B-items usually need regular attention without the same level of oversight.
C-items may be suitable for simpler planning rules when the business can tolerate them. In some cases, buyers may review them less often or use larger order intervals to reduce administrative work.
Here is one way to think about the differences.
| Inventory activity | A-items | B-items | C-items |
| Review frequency | More frequent | Regular | Less frequent where appropriate |
| Forecast review | Closer attention | Standard review | Simpler approach may work |
| Reorder settings | Reviewed carefully | Reviewed periodically | Can often use simpler rules |
| Supplier performance | Higher visibility | Regular monitoring | Exception-based monitoring may be enough |
| Cycle counting | May receive higher priority | Moderate priority | Lower priority depending on risk |
| Buyer attention | Higher | Balanced | Lower unless another risk applies |
ABC classification gives teams a practical way to decide where human attention should go.
Without some form of prioritization, buyers can end up spending as much time reviewing a low-impact item as they spend on a product carrying much more financial exposure.
ABC analysis can help purchasing focus its time
Purchasing teams often have more exceptions than they can review in detail every day.
ABC classification can make those queues more useful.
Suppose a buyer receives 300 replenishment recommendations. Reviewing every recommendation with the same level of care may take hours. If the system can identify which recommendations involve A-items, the buyer can start with the items carrying the greatest exposure under the chosen classification.
The same approach can support supplier reviews.
If several A-items depend on one supplier, lead-time changes or late deliveries from the supplier may deserve closer attention than delays affecting a small number of lower-impact products.
ABC analysis will not make the purchasing decision for the buyer. It helps decide where deeper review is worth the time.
ABC analysis can support replenishment rules
Replenishment works better when different types of items can follow different rules.
An A-item may justify tighter safety-stock review or more frequent parameter updates.
A C-item with stable demand may work well under a simpler approach.
The classification can also help teams decide which items deserve more frequent review of lead times, order quantities, or supplier performance. From an ERP perspective, the useful question is whether the classification can feed the planning process.
Can the ERP store the ABC class?
Can reports filter or group items in class?
Can planners apply different replenishment rules?
Can buyers sort exceptions so high-priority items appear first?
If the answer is no, teams may calculate ABC classifications in a spreadsheet but struggle to use them in daily work.
Where the data matters
I usually work heavily on ERP development, integrations, and the way information moves between business systems. With ABC analysis, the calculation itself is rarely a complicated part.
The harder question is whether the inputs can be trusted.
Annual usage may come from sales history, shipments, warehouse transactions, or another source depending on how the business operates. Unit cost can also mean different things depending on how inventory is valued.
Before using the output, I would want the business to be clear about a few points.
- Which transaction counts as usage?
- Which cost is being used?
- Are returns included?
- Are discontinued items mixed into the list?
- Are new products being compared with items which have a full year of history?
- Are transfers between warehouses being counted as demand?
Those decisions can change the classification.
A spreadsheet can produce a perfectly clean A, B, and C list while still starting from data which does not reflect how the business wants to measure inventory.
ABC classification should not be confused with product importance
One of the biggest limitations of ABC analysis is that it is easy to miss.
A low-value item can still be critical.
Think about a small part which costs very little but is required to complete a larger order. Its annual consumption value may be put in the C-class. If the part stocks out, the distributor may be unable to ship a much more valuable product.
The opposite can happen, too.
An expensive item may rank highly because of its cost, even if demand is rare, and the company does not need to hold much stock.
ABC analysis tells you how items rank according to the measure you selected.
It does not understand every operational consequence surrounding the item. For this reason, many distributors benefit from looking at ABC alongside other factors.
ABC analysis versus other inventory questions
| Question | Can ABC analysis answer it? |
| Which items represent the most annual consumption value? | Yes |
| Which items deserve closer financial control? | Often useful |
| Which items have unpredictable demand? | No |
| Which items are critical to customer orders? | No |
| Which items have long or risky supplier lead times? | No |
| Which items have the highest margin? | Only if margin is part of the chosen measure |
| Which items are becoming obsolete? | No |
| Which items should always be kept in stock? | No |
A useful inventory policy often combines several views rather than relying on ABC alone.
An item can be C-class by annual value and still deserve high service levels because customers depend on it. Another item may be A-class but need careful stock limits because demand is intermittent.
The classification should inform the discussion rather than end it.
A practical workflow for using ABC analysis
Step 1 – Decide what you are trying to prioritize
Start with the business question. Do you want to focus on purchasing time, review inventory value, improve cycle counting, or prioritize replenishment settings? The purpose should guide the measure used in the analysis.
Step 2 – Choose the input data
For a traditional ABC analysis, annual usage and unit cost are common inputs. Use a consistent time period to make sure the business agrees on how usage and cost are defined.
Step 3 – Calculate the item value
Multiply annual usage by unit cost for each item. Sort the results from the highest to lowest.
Step 4 – Calculate cumulative contribution
Work through the sorted list and calculate how much each item contributes to the total. The cumulative view helps show where natural breakpoints appear.
Step 5 – Assign the classes
Choose the A, B, and C boundaries based on the distribution of the data and the way the business plans to use the groups. Avoid forcing a fixed percentage if it creates a classification which is hard to manage.
Step 6 – Review the exceptions
Ask purchasing, operations, warehouse, and finance whether any items need special treatment. Critical parts, new products, seasonal items, and long-lead-time products may deserve a different approach even when their ABC class suggests otherwise.
Step 7 – Put the classification into the operating process
Use the results in replenishment reviews, purchasing queues, reporting, cycle counting, or inventory policy. If the ABC code only lives in a spreadsheet, nobody opens; the analysis has limited value.
Step 8 – Review it again
Product mix changes. Costs change. Customers have changed. Demand shifts. A classification built once and never reviewed will slowly become less useful.
Where ERP can help
ABC analysis does not require a new ERP.
A distributor can calculate it in a spreadsheet if the data is available.
The bigger question is whether the ERP can turn the classification into something people can use.
A modern ERP may be able to store item classes, support different replenishment approaches, prioritize reports, or provide better visibility into the inventory data behind the analysis.
For platforms such as Acumatica, the evaluation should start with the business requirement.
Can the system give you clean items, usage, cost, supplier, and warehouse data?
Can the classification be refreshed without rebuilding the process manually?
Can planners and buyers use the result in daily work?
Can exceptions be managed inside the same environment?
Those questions matter more than whether the software has a field called “ABC class.”
In my role at Vantris, I spend much of my time looking at technical requirements which sit between configuration, integrations, and custom development.
For an ABC process, I would like to understand where the source data comes from, how the classification is calculated, and how the result needs to flow back into the ERP or other operating systems.
The goal is to keep the process maintainable.
ABC analysis works best as a prioritization tool
ABC inventory analysis gives distributors a useful way to stop treating every SKU as if it carries the same weight.
It can help purchasing focus on its time, give planners a clearer review order, and support different replenishment or control rules for different groups of items.
The method also has limits, though.
ABC alone cannot tell you which products are critical to customer service, which suppliers are risky, which items have unpredictable demand, or which products should always be kept in stock.
Use it as one view of the inventory.
Start with reliable data, choose a measure which matches the business question, review the exceptions, and make sure the classification leads to a practical change in how inventory is managed.
For growing distributors, the useful part is rarely the A, B, or C label itself. The value comes from deciding what the business will do differently once those groups are visible.
Common questions about ABC inventory analysis
What does ABC mean in inventory management?
ABC inventory analysis groups items according to their relative importance under a chosen measure. A-items receive the highest priority, B-items sit in the middle, and C-items receive lower priority under the same measure.
How do you calculate ABC inventory?
A common method calculates annual consumption value by multiplying annual usage by unit cost. Items are ranked from highest to lowest, cumulative contribution is calculated, and the items are then grouped into A, B, and C classes.
What percentage of inventory should be A, B, and C?
There is no single percentage which fits every distributor. Example percentages are often used when teaching the method, but the final breakpoints should reflect the company’s inventory mix and how the classes will be used.
How often should ABC analysis be updated?
The right frequency depends on how quickly product mix, costs, and demand change. Businesses with frequent item or pricing changes may need more regular updates than businesses with a stable catalogue.
What are the limitations of ABC inventory analysis?
ABC analysis usually looks at one measure at a time. It may miss factors such as demand variability, customer importance, supplier risk, product criticality, margin, seasonality, or obsolescence.
Can ABC analysis be done in an ERP?
Yes, depending on the system and configuration. The ERP needs reliable item, usage, and cost data, plus a way to store or use the resulting classification. Some businesses calculate the classification outside the ERP and then feed the result back into the system.
About the author
JB Uy is Head of Development at Vantris.
JB brings 15 years of ERP development experience, including serving as CTO of a SaaS platform supporting large employee populations. His work has included integrations across ERP, payroll, time tracking, ecommerce, warehouse systems, and other applications businesses depend on every day.
At Vantris, JB leads development with a focus on integrations and technical requirements which cannot be handled through configuration alone. His manufacturing and distribution experience helps the team identify where data can break down, how systems should exchange information, and how custom work can remain maintainable.